
Veeam is the market leader in the backup space and one of the most well known companies out there in the industry.
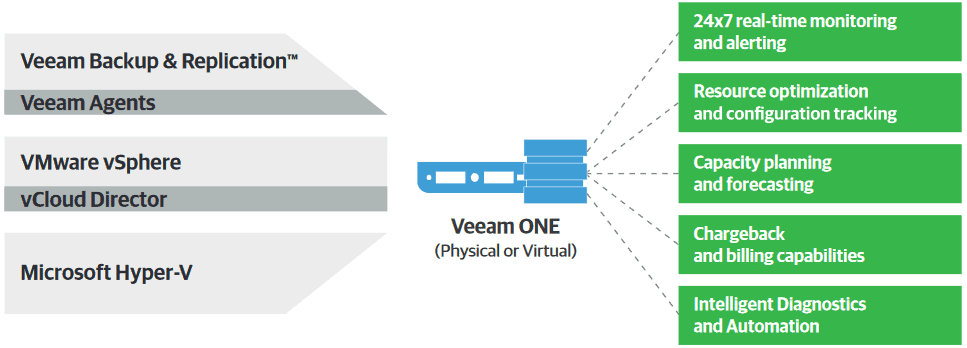
However many customers are unaware that Veeam have a substantial monitoring and analytics platform for advanced visibility into your datacentre environment, known as Veeam ONE.
Are you fully aware of the performance of all your Hypervisors? Are you aware of potential issues before they turn into a major problem, in real time? If the answer is “no” or “maybe” to these, then Veeam ONE is able to help.
At Vitanium, we are able to offer Veeam ONE alongside their Backup & Replication offering, for a true all in one protection and monitoring solution that can provide 24x7x365 real-time visibility into virtual environments.
This article will be a brief introduction to Veeam ONE and just some of the capabilities it has.
Installation
Download from https://www.veeam.com/virtualization-management-one-solution.html along with a trial key.
Install on a machine that has access to your hypervisors – this could be an existing server, or just a management workstation.
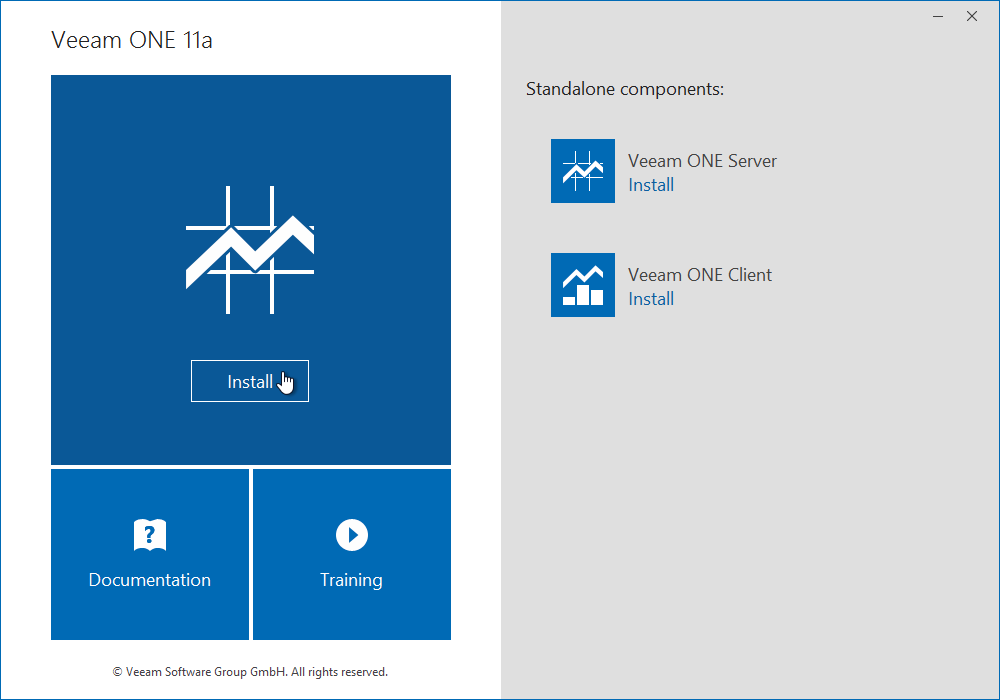
The installer installs 2 components, a web based GUI and a client GUI, both of which can be used hand in hand – reports are generally created via the web GUI whilst the client administers the setup.
Accessing Veeam ONE:
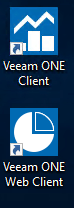
Once installation completes, there will be icons in the Start menu and desktop:
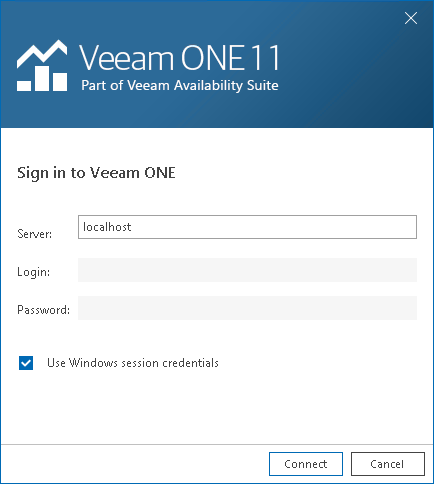
Open the Client and login with Windows credentials of the server you have deployed Veeam ONE to:
Once loaded, the main screen will show you a button to Add Server (either at the top or in the main window):
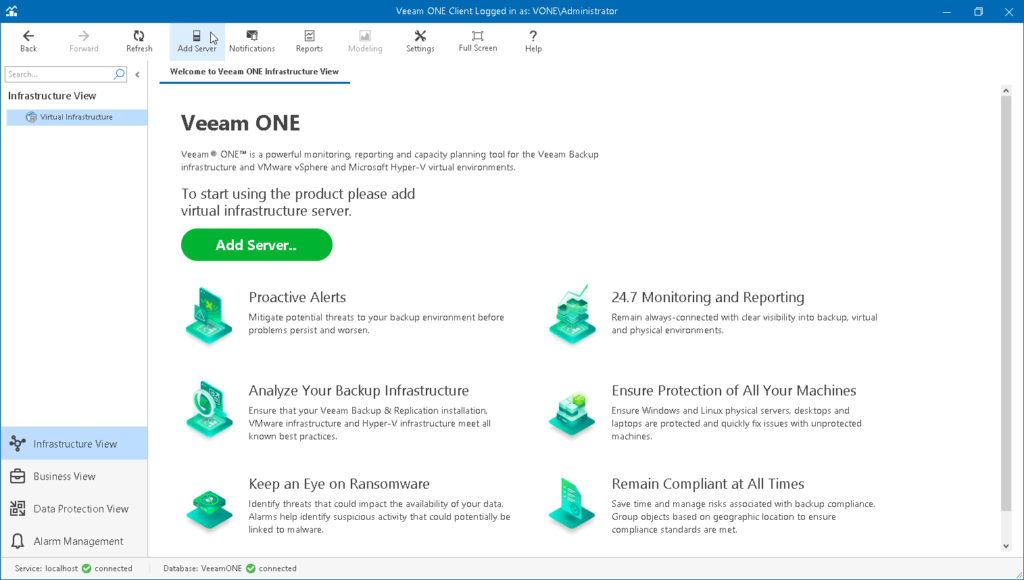
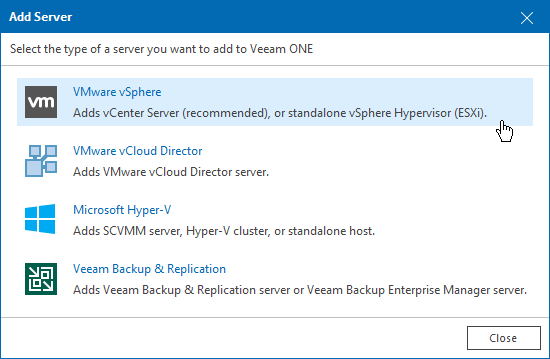
Follow this wizard through to add the first Hypervisor to be monitored:
Repeat the above process for all hosts within the environment to be monitored, data will start to be collected across all machines.
Reviewing Data
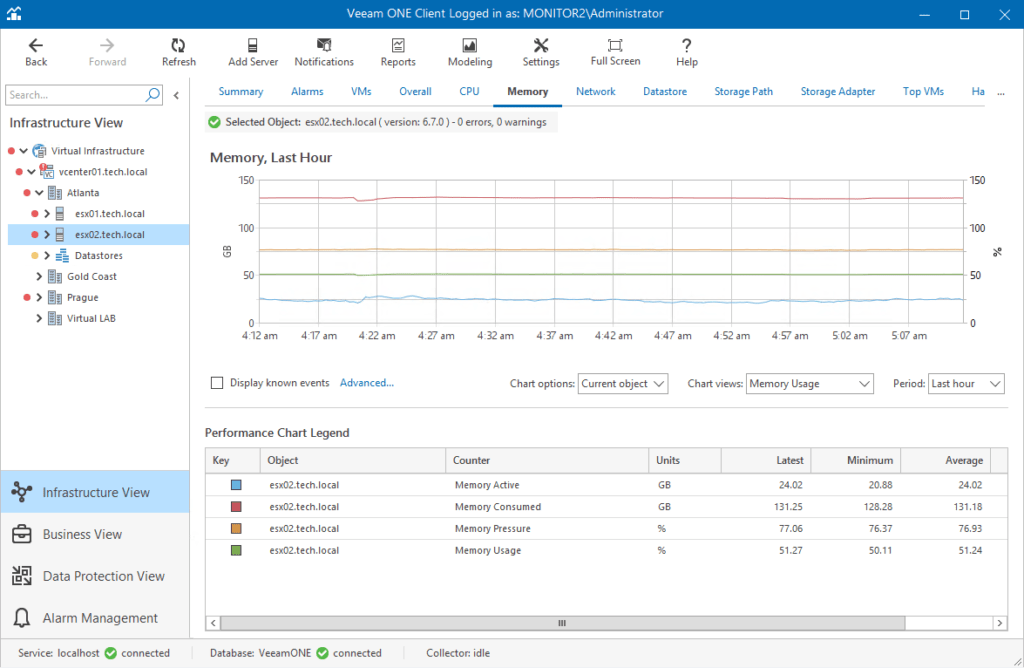
Some data is visible directly within the console itself. If you go to Infrastructure View, expand out the Virtual Infrastructure tree and select a server, the details of that server will load.
Along the top, you can choose, Memory/CPU/Network to view current and recent usage for that host specifically.
The Alarms tab will show you any notifications about the machine which may need resolving.
Reviewing Alarms
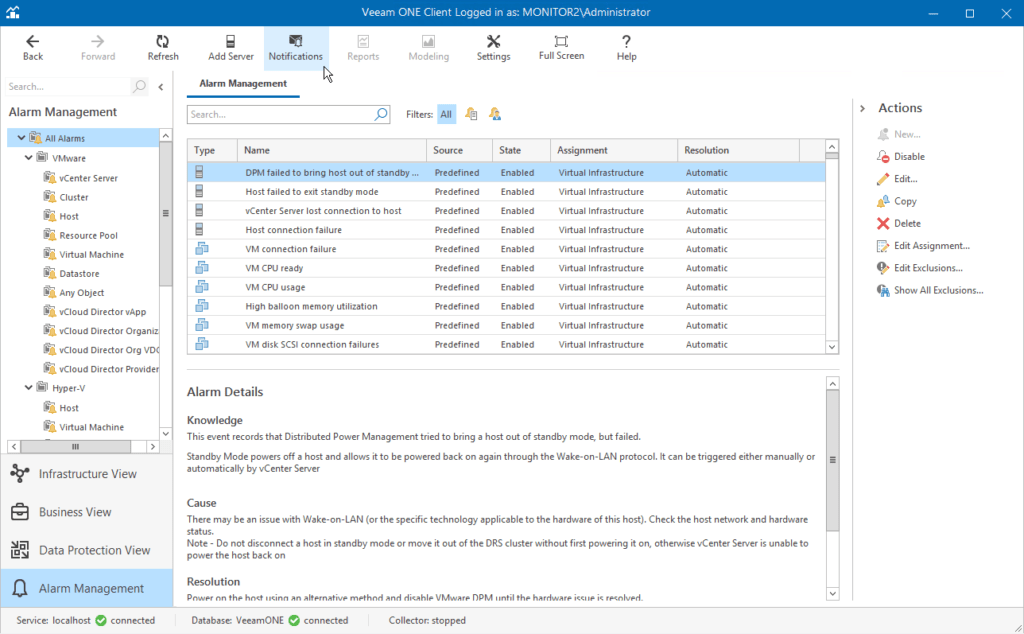
By default, alarms are all preconfigured within Veeam ONE to set parameters. These can be adjusted by going to Alarm Management as needed for your environment.
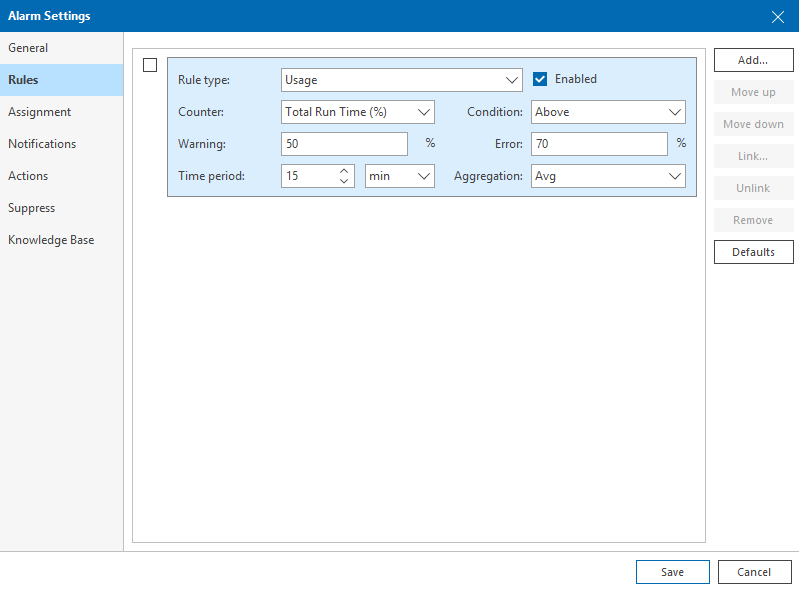
For example, if you go to All Alarms -> Hyper-V -> Host and double click “Host CPU Usage”
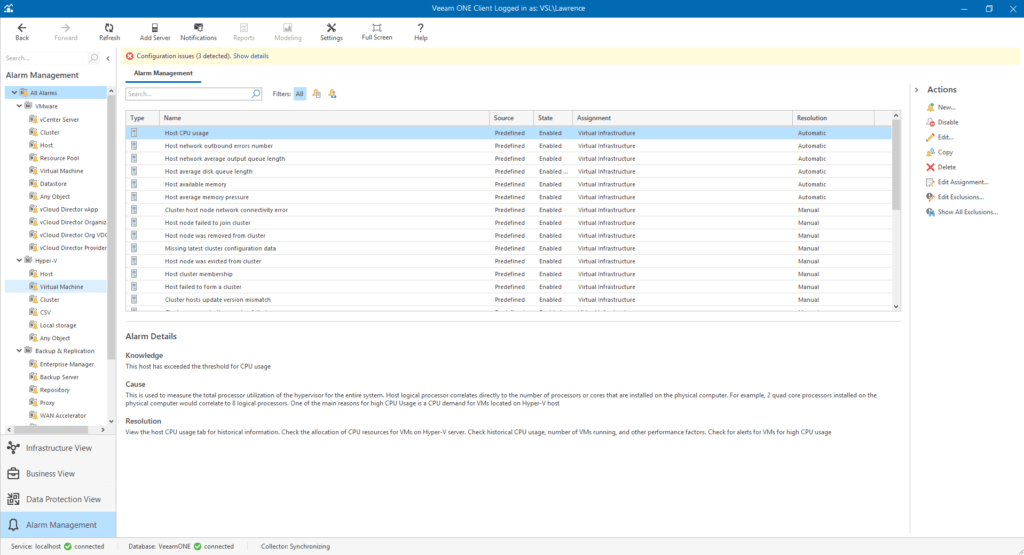
Under Rules, you can see by default the alert starts to warn at 75% CPU usage over 15 minutes, and errors at 85%.
It may be within your environment that the hosts run much cooler, and so more appropriate values could be 50% for warning, and 70% for error. Simply update the relevant fields and click save:
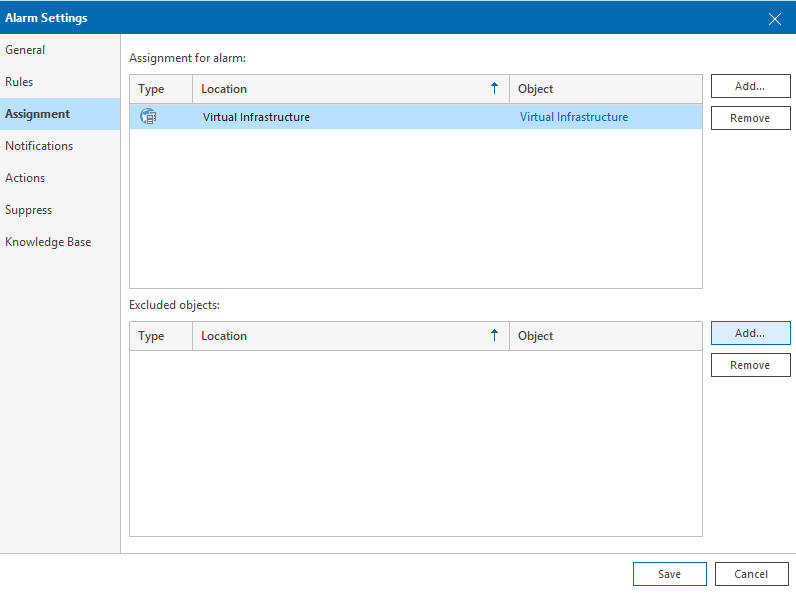
Under the Assignment tab, you can see by default the rule is assigned to ‘Virtual Infrastructure’, i.e. all hosts that have been added. It’s possible to change this to specific groups, or exclude specific hosts if they don’t need to be monitored (maybe a test environment or similar).
By default, alerts show up in the GUI as a machine with a ‘red’ or ‘orange’ alert, but it may be preferable to configure notifications to be sent via email as and when alerts occur.
To do so, click the Notifications button at the top of the client application:
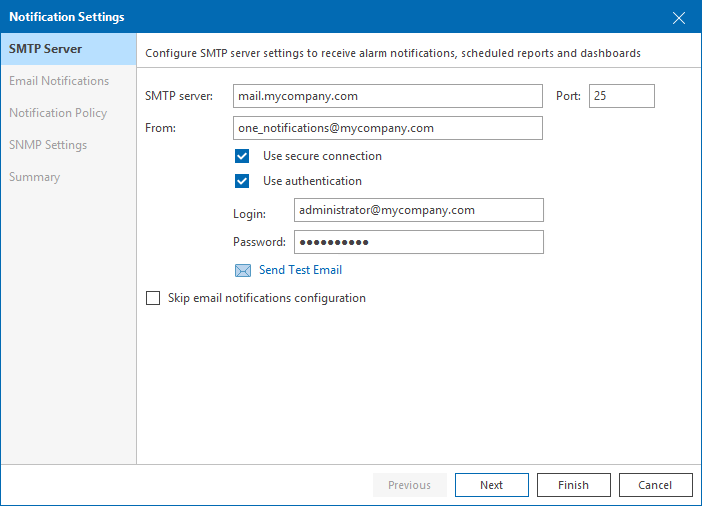
Specify SMTP server details for sending notifications out:
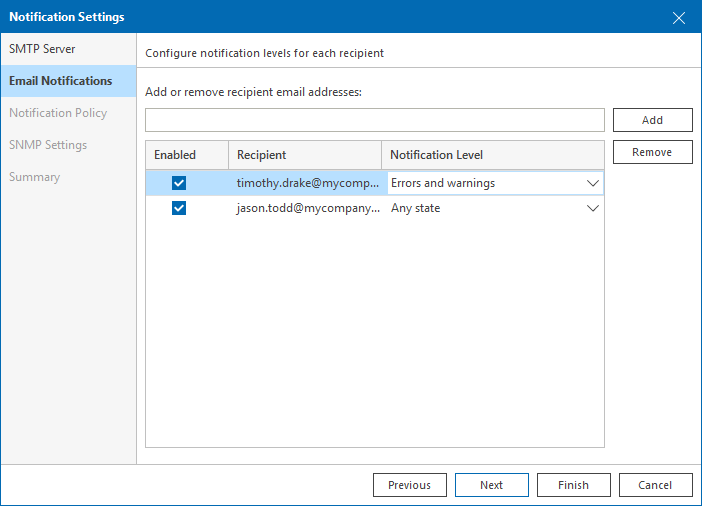
On the Email Notifications, you can choose recipients for the alarms. E.g. an engineer may want all errors and warnings, IT Manager may only wish to receive errors:
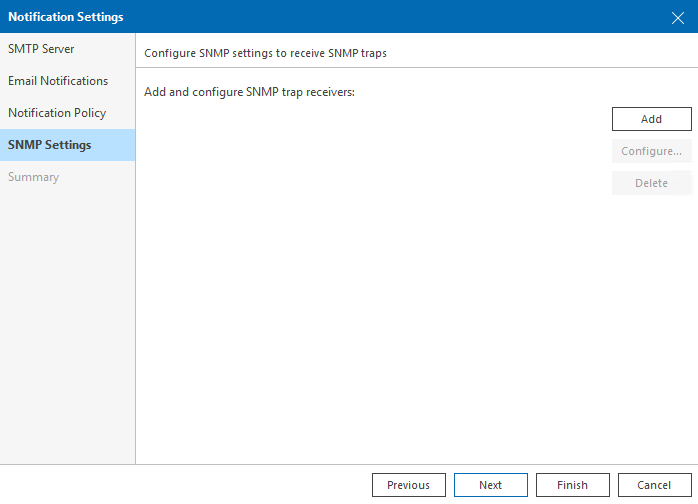
It’s also possible to configure SNMP traps if this is in use in your environment:
Reviewing Reports
The last section we will cover on a Veeam ONE deployment involves reports. On the start/desktop menu, there should be a shortcut to Veeam ONE Web Client.
Open this and login with Windows credentials. Under the reports tab on the top, there are lots of preconfigured options.
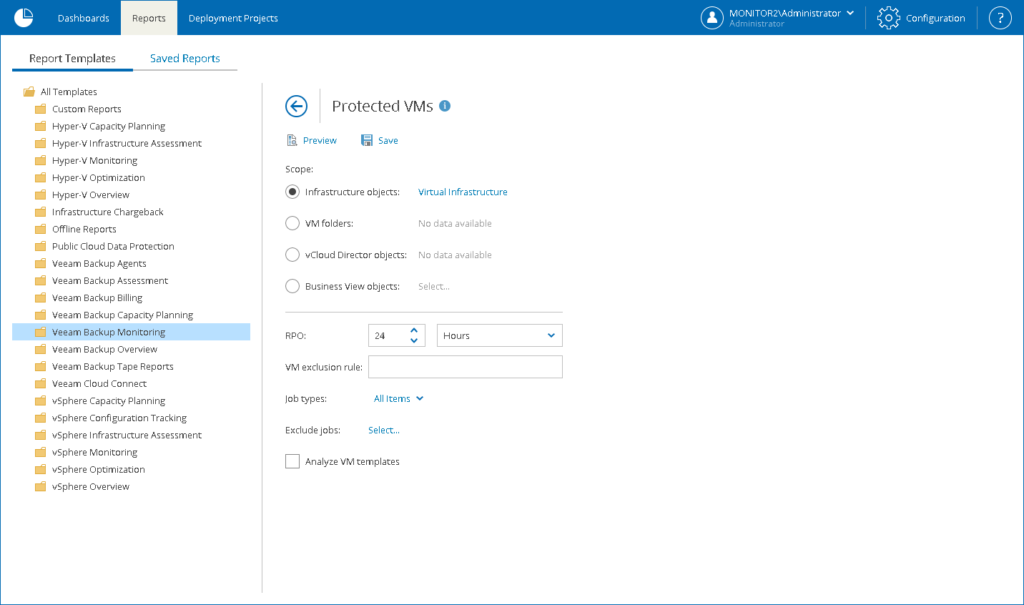
A good one to start is under Veeam Backup Monitoring -> Protected VMs. This report shows you all backed up vs not backed up VMs within your environment.
Select this and choose the scope (by default Infrastructure Objects: Virtual Infrastructure):
Select Preview and the report will be generated in your browser window.
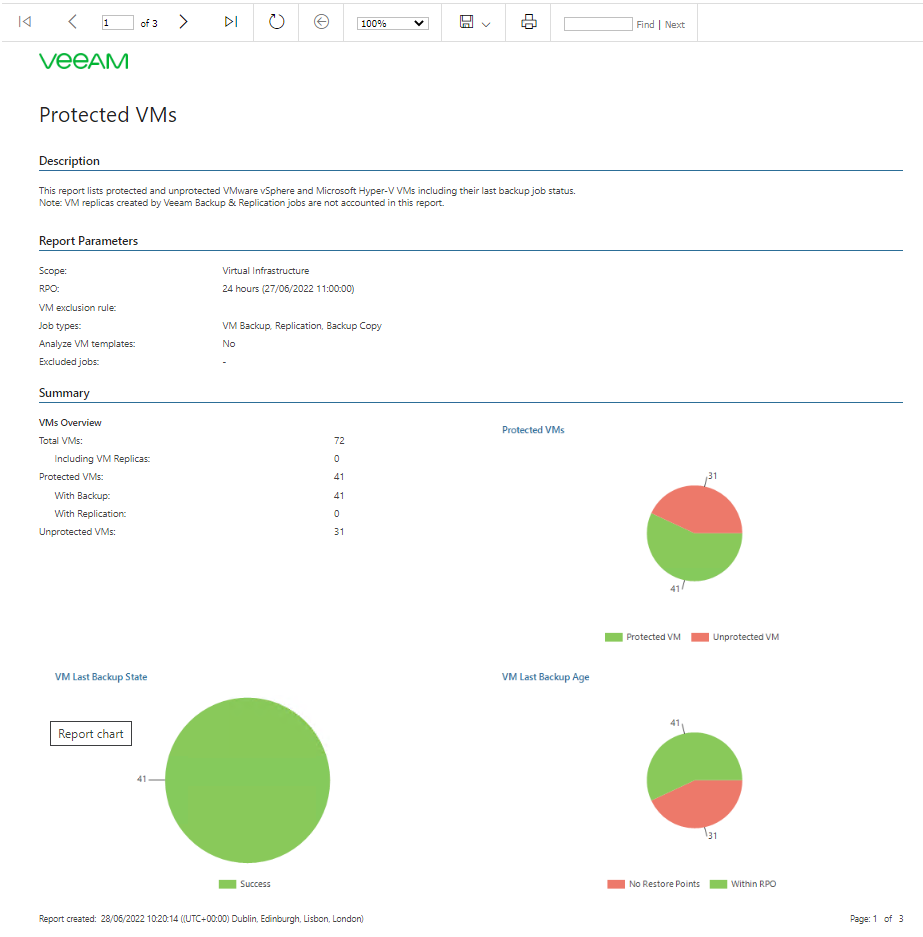
You can also choose to save this instead, which will save any customisations as a custom report for easy access later on.
Have a click through the reports as there is lots of pre-built info available.
Summary
This was just a brief overview of some of the capabilities of Veeam ONE. There is a useful getting started guide at About Veeam ONE – Veeam ONE Quick Start Guide
You can also view the details of all reports available at Predefined Veeam ONE Reports – Veeam ONE Reporting Guide
Of course, we’re always happy to help with a Veeam ONE deployment as well! Feel free to Contact Us for any further advice.